Energy
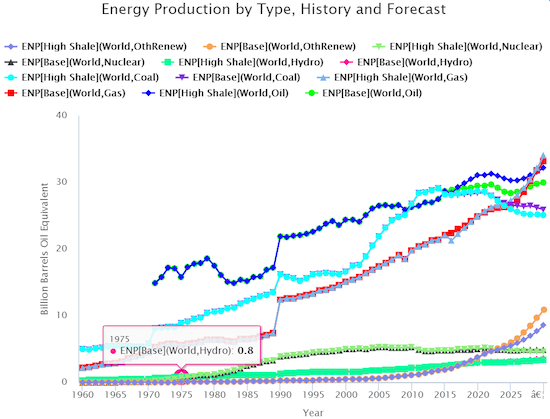
Recent technological advances are reshaping the world’s energy supply, making exploration of possible future paths in the energy sector all the more important for global development. The IFs energy model allows us to explore the world’s energy sector in depth, providing historical data and forecasts on the size of energy reserves, energy production levels by type, the import and export of energy, and the global price of energy. The graph below shows how world energy production, broken down by type (oil, gas, hydro, nuclear, and other renewable), has changed over time and may evolve going forward under both the IFs Base Case and an alternative scenario where further rapid advances in technology lead to even greater oil and gas production.
The graph below shows not only how energy production has evolved over the last fifty years, but also how drastically technological advances after the year 2000 have changed the energy equation. Gas and oil production has surged, even beginning to supplant coal in certain high-income countries. The graph also shows the rise of India and China over the last two decades, as the major increase in coal production after 2000 came largely from these rapidly industrializing countries.
Going forward, the IFs Base Case suggests gas and oil production will likely continue to accelerate out to 2030, as will renewable energy after reaching a taking off point in 2015. However, in the alternative scenario, the further acceleration of gas and oil production comes at the expense of renewables, which won’t see as much early momentum as compared to the Base Case.

