Infrastructure
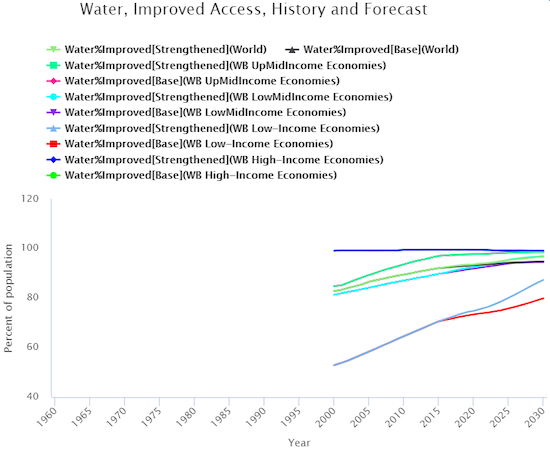
Millions of people still live without access to clean water and improved sanitation. With the IFs infrastructure model, we can explore how access to clean drinking water has changed over time, and whether and when the populations of developing countries might have universal access to clean water in the future. The graph shows access rates to clean drinking water by country income groups since 1990. At the global level, access to clean water has grown quickly, and will likely continue to do so, reaching over 90 percent of the world's population by 2030 in the IFs Base Case.
But as the graph shows, the global average masks major disparities among countries. With IFs, we can build an alternative scenario, in which policymakers give high priority to increasing access to safe water and improved sanitation, to see what interventions might accelerate the provision of water infrastructure; the scenario shows the impact of a set of aggressive but reasonable interventions intended for this purpose For more information about the scenario, see Building Global Infrastructure, Volume 4 of the Patterns of Potential Human Progress series.
The provision of water and sanitation infrastructure is more than an end in and of itself; it also has societal benefits that extend across health, education, productivity, and equality. IFs lets you follow the interventions as their consequences unfold throughout these and other systems.

