Economy
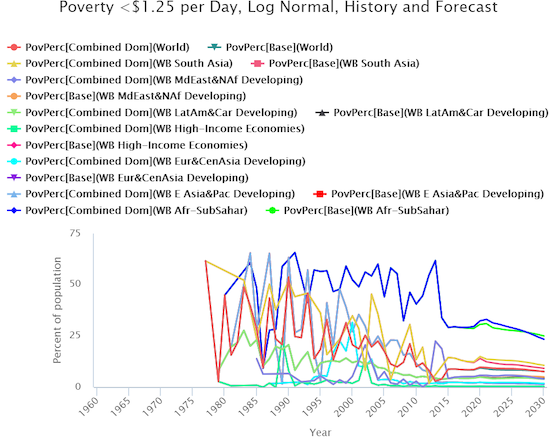
Globally, 1.2 billion people who live in extreme poverty are forced to survive on less than $1.25 per day. The IFs economic model allows us to explore what it might take to reduce or even eliminate extreme poverty in the future. The graph shows how the percentage of the world’s people living in extreme poverty (broken out by region) has changed over time. Beginning in 2010, IFs extends these changes to 2030 under two scenarios: the IFs Base Case and an alternative scenario, in which a set of aggressive but reasonable poverty-reduction interventions take place.
Globally, the percentage of people living in extreme poverty has decreased significantly (although not smoothly or uniformly) since 1980, a trend that’s likely to continue in the future. At the regional level, every region has experienced some reduction in extreme poverty, but the rate and the size of the reductions have differed greatly between regions and are likely to continue to do so. Notably, in the IFs Base Case forecast, extreme poverty remains a significant problem in 2030.
Reducing global poverty was the focus of Volume 1 in our five-volume Patterns of Potential Human Progress series. In that volume we developed an alternative scenario where national governments and the international community implement concerted efforts to reduce poverty by reducing fertility rates, increasing female participation in the labor force, and reducing trade protectionism and other barriers to trade.
However, it often takes some time for an intervention to gain traction. In fact, in the alternative scenario, the percentage of people living in extreme poverty actually increases slightly before declining due to the initial costs of investing funds from other purposes into the poverty-reduction interventions. As a highly integrated model, IFs accounts for the fact that the real-world impacts of policy interventions are not confined to one issue area.
IFs Training Videos
-
IFs Training Video: Economy 5.01
-
IFs Training Video: Economy 5.02
-
IFs Training Video: Economy 5.03
-
IFs Training Video: Economy 5.04
-
IFs Training Video: Economy 5.05
-
IFs Training Video: Economy 5.06
-
IFs Training Video: Economy 5.07
